.jpg&w=1080&q=75)
How Indian Agency Owners Automate Client Reporting & Analytics Using AI in 2026

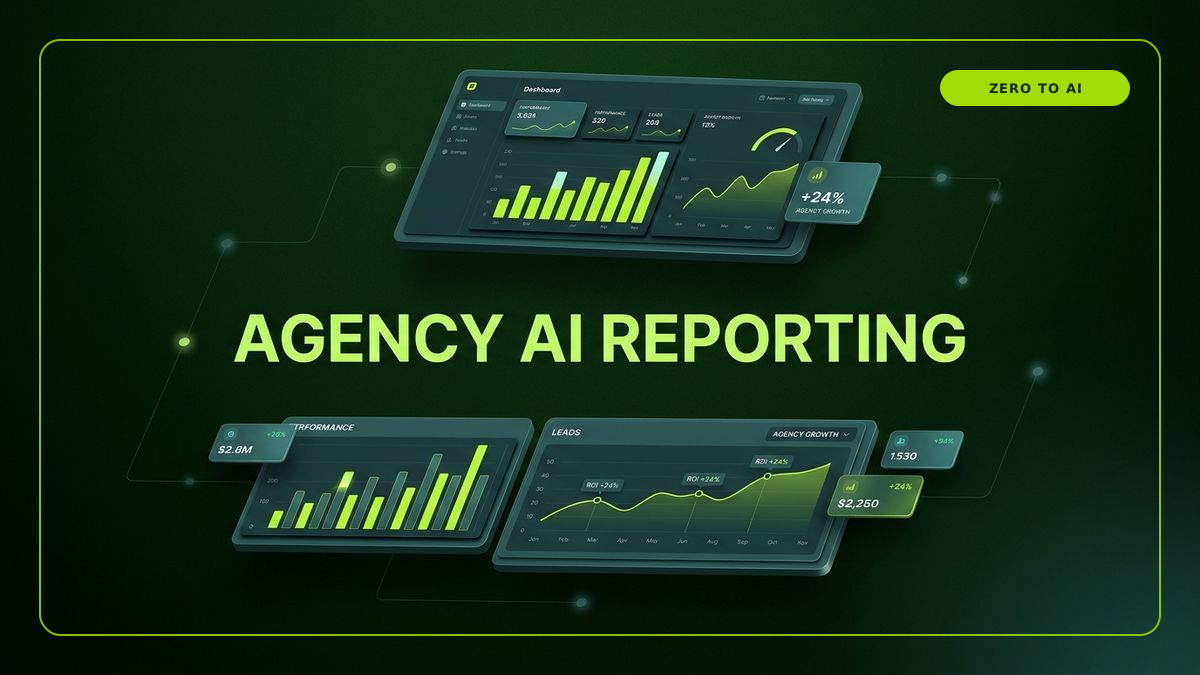
Digital agency owners automate client reporting by connecting Google Analytics, Meta Ads, and AI models via Make.com to generate executive performance summaries automatically.
For digital marketing, SEO, and web development agencies across India, preparing monthly client performance reports is a major time sink. Account managers spend hours manually exporting data from Google Analytics, Meta Ads, Google Ads, and CRM platforms into slide decks or spreadsheets. Clients often find raw metrics confusing and prefer concise executive summaries highlighting key business insights. In 2026, forward-thinking agency owners leverage AI models and no-code visual automation to generate, summarize, and deliver personalized client reports in minutes.
Automating the analytics pipeline frees agency staff to focus on strategic growth, improves client retention, and eliminates repetitive administrative overhead.
Manual Agency Reporting vs Automated AI Reporting Systems
Comparing traditional reporting routines with an automated AI reporting pipeline reveals significant operational efficiency gains:
Feature | Manual Agency Reporting | Automated AI Reporting System |
|---|---|---|
Data Collection | 2 to 4 hours per client gathering metrics | Instant API data extraction across all channels |
Analysis & Insights | Standard copy-paste numbers with minimal narrative | AI generates context-aware strategic commentary |
Delivery Schedule | Often delayed by days due to manual workload | Sent automatically on fixed weekly or monthly dates |
Customization Level | Generic template used across all client accounts | Tailored insights matching each client's business KPIs |
Human Labor Required | 15 to 20 staff hours monthly per 10 clients | Under 30 minutes total for human verification |
The 4 Components of an Automated Agency Reporting Engine
An automated AI client reporting engine consists of four interconnected workflow stages:
[Ad & Web Data Connectors] ──> [Data Aggregation Sheet] ──> [AI Insight Summarizer] ──> [Client PDF / Email Delivery]1. Multi-Channel Data Extraction
Visual connectors in Make.com or n8n pull performance metrics—such as website traffic, conversion rates, ad spend, cost per lead, and return on ad spend (ROAS)—directly from platform APIs into a central Google Sheet database.
2. Metric Normalization & Aggregation
The system standardizes metrics across channels, calculating performance variations compared to the previous reporting period (e.g., month-over-month percentage growth).
3. AI Insight Generation Engine
An LLM model analyzes the aggregated performance figures and generates a clear executive summary. The model highlights top-performing campaigns, explains traffic fluctuations, and recommends actionable next steps.
Agency Report Prompt Blueprint:
"You are a Senior Digital Strategy Director for an Indian growth agency.
Input Data: {Client_Monthly_Metrics}.
Task: Write a 3-paragraph executive performance report for the client CEO.
Paragraph 1: Summarize key wins, total lead volume, and blended CAC.
Paragraph 2: Explain main drivers of performance change compared to last month.
Paragraph 3: Outline 3 strategic recommendations for next month's campaign optimization."
4. Automated Formatting & Delivery
The final text report and visual metrics table are formatted into a clean PDF or branded email newsletter and dispatched directly to the client's inbox or Slack channel.
Step-by-Step Roadmap to Automate Agency Client Reports
Follow this 5-step blueprint to automate your agency's reporting workflow this week:
- Audit Required Client Metrics: Identify the top 5 to 7 key performance indicators (KPIs) each client cares about most.
- Build a Central Reporting Sheet: Create a master Google Sheet template designed to receive raw performance data via API connectors.
- Set Up Make.com API Integrations: Connect Google Analytics 4, Meta Ads Manager, and Google Ads to your master reporting sheet.
- Configure the AI Summarizer Node: Pass monthly metric totals into ChatGPT or Claude API nodes to generate executive narrative summaries.
- Implement Pre-Send Quality Check: Set an automated trigger that notifies account managers 24 hours before report dispatch for quick review.
Frequently Asked Questions (FAQs)
How accurate are AI-generated client analytics summaries?
AI models generate highly accurate summaries when provided with structured numerical data from verified API connectors and guided by clear prompting rules.
Can we customize AI report tone for different client types?
Yes. Prompts can be adjusted per account, ensuring enterprise clients receive formal executive briefings while startup founders receive casual, punchy updates.
What is the monthly cost for an agency running automated AI reports?
For an agency managing 15 to 30 accounts, automated reporting software and API usage costs between ₹1,500 and ₹4,000 per month, saving over 40 hours of manual work.
How do clients react to automated AI-assisted reports?
Clients overwhelmingly prefer automated reports because they arrive consistently on schedule and provide clear, readable business insights rather than overwhelming data tables.

Learn to build AI workflows that handle your busywork — live sessions, real projects, zero code.
See the courseBeginner-friendly